Resources for Understanding and Exploring K-Means Clustering Algorithms
K-means clustering is classified as an unsupervised machine learning technique due to its fundamental characteristic: it does not require labelled data for training. Unlike supervised learning algorithms that rely on labelled examples to learn patterns and make predictions, unsupervised learning algorithms, such as K-means, work on unlabelled data. The primary objective of K-means is to identify clusters of similar data points based solely on the patterns and relationships within the data itself (Vattani, 2011).
Figure 1: K-means clustering animation, starting with 4 left-most points (Shabalin, 2007).
Figure 1 shows an animation by Shabalin (2007), in which the process begins with the placement of the first cluster centroids, suggesting that four centroids are initially chosen. These centroids are crucial as they define the starting points for the clustering process. The animation demonstrates how the algorithm proceeds in two alternating steps:
• Reassign Points: Each data point is assigned to the cluster whose centroid is closest. This step dynamically reshapes cluster membership based on distance to the current centroids.
• Update Centroids: After reassigning points, centroids are updated by recalculating the mean of all points within a cluster.
This iterative process continues until convergence, either when centroids stabilise or data points no longer change cluster affiliation. The animation illustrates how clusters gradually take shape and how centroids adapt to better represent the underlying data structure.
Figure 2: Visualising K-means clustering for uniform points (Harris, 2014).
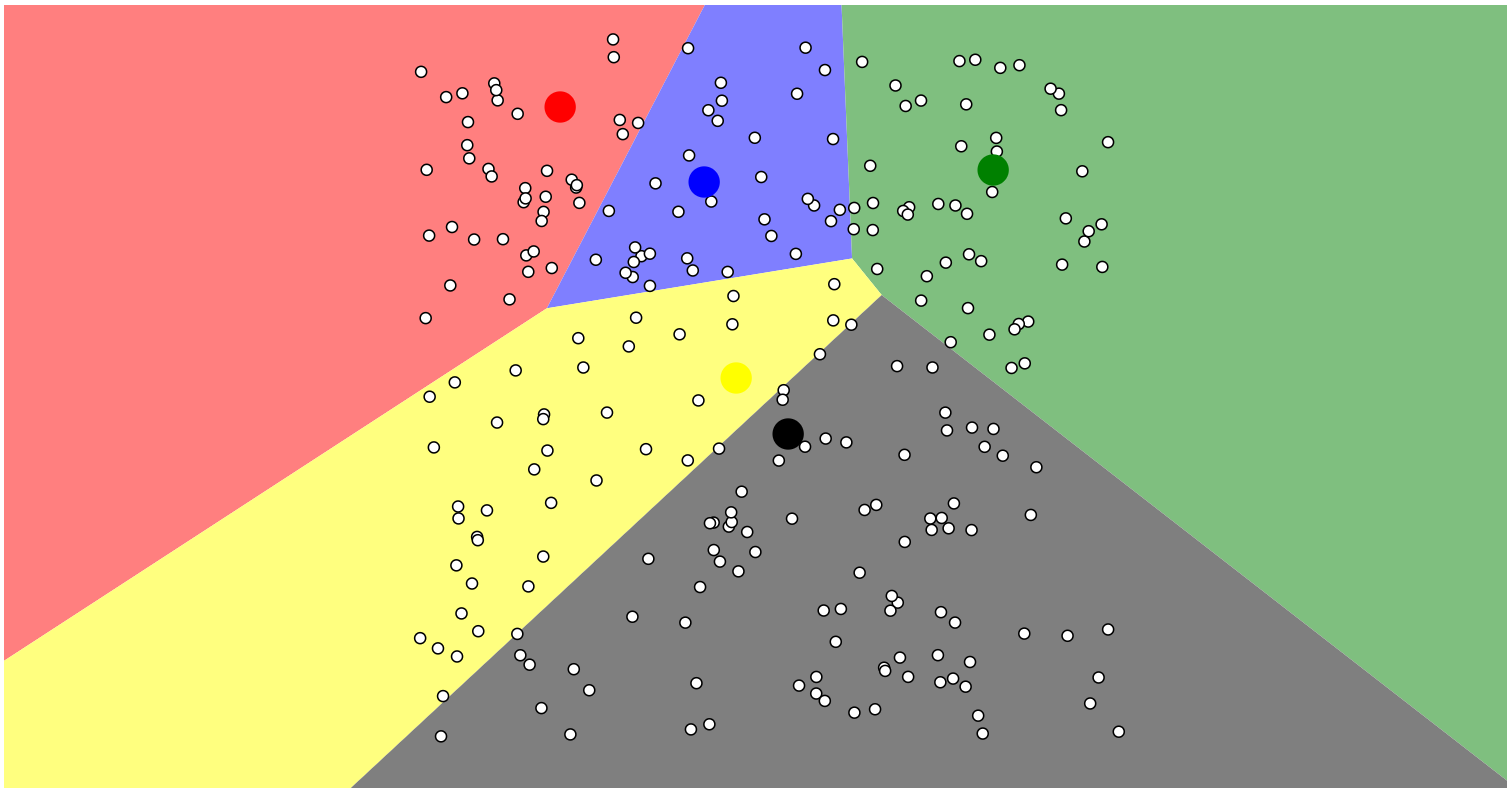
A second animation by Harris (2014) provides insights into the convergence behaviour of K-means and the impact of initial centroid positions. It highlights the algorithm’s susceptibility to producing different outcomes depending on the starting conditions—a phenomenon that underscores the importance of good initialisation strategies. The text further explores various initialisation techniques, including random initialisation, the “farthest” heuristic, and the k-means++ method. These methods aim to improve clustering results by selecting centroids in ways that are more likely to reflect the natural structure of the data.
However, K-means clustering is not without its limitations. It performs best when clusters are roughly spherical, equally sized, and well-separated. In scenarios involving uniform distributions or overlapping clusters, such as those shown in Figure 2, K-means may struggle to find meaningful groupings. The algorithm may instead impose artificial partitions that do not reflect any real structure in the data. Moreover, the assumption that each cluster is equally important or dense is rarely true in real-world data, reducing the model’s effectiveness in more complex applications.
Animations like those by Shabalin and Harris are valuable pedagogical tools. They offer an intuitive understanding of K-means’ iterative logic and visually demonstrate how convergence is achieved. Yet, they also reveal the algorithm’s limitations, especially in terms of sensitivity to initialisation and rigid assumptions about data geometry.
Overall, K-means clustering remains a popular and effective technique for exploratory data analysis and pattern recognition. Its simplicity and computational efficiency make it attractive for large-scale applications. However, its performance is heavily influenced by initial centroid placement, data distribution, and cluster assumptions. As such, it is vital for practitioners to critically assess whether K-means is appropriate for their specific use case, and to complement it with domain knowledge, validation metrics, and alternative clustering methods when necessary. Only through such critical application can the full potential of K-means be realised without misrepresenting or oversimplifying the underlying data.
References:
Harris, N. (2014). Visualizing K-Means Clustering. [online] Naftaliharris.com. Available at: https://www.naftaliharris.com/blog/visualizing-k-means-clustering/ [Accessed 27 Dec. 2023].
Shabalin, A.A. (2007). K-means clustering, starting with 4 left-most points. [online] shabal.in. Available at: https://shabal.in/visuals/kmeans/2.html [Accessed 27 Dec. 2023].
Vattani, A. (2011). k-means Requires Exponentially Many Iterations Even in the Plane. Discrete & Computational Geometry, 45(4), pp.596–616. doi:https://doi.org/10.1007/s00454-011-9340-1.